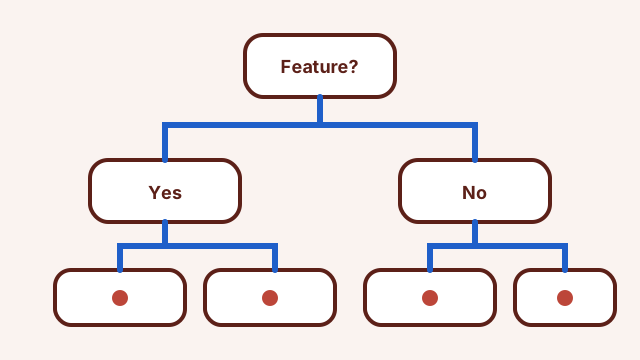
Decision Trees
Follow a sequence of questions to see how a tree makes a prediction.
Lets see what piques your interest!
Pick a model to explore its ideas with interactive visuals and hands-on controls.
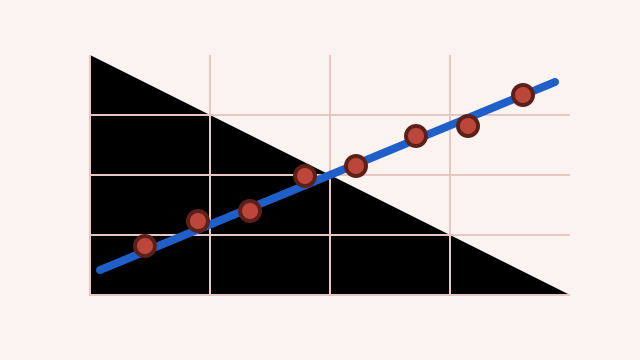 Linear Regression
Adjust slope and intercept to see how a straight line models continuous data.
Open lesson
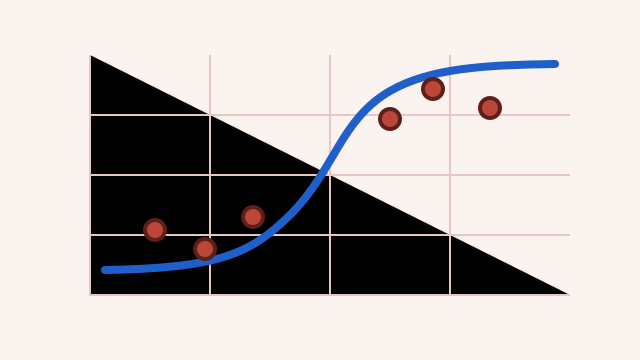
Explore how a model estimates the chance that something belongs to a class.
Open lesson
Follow a sequence of questions to see how a tree makes a prediction.
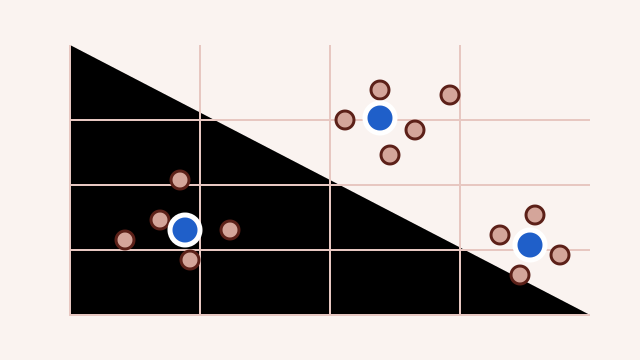
See how data points gather into groups around moving centres.